
Potato Rot School
A practical enablement course for detecting, diagnosing, and managing rot risk in commercial potato storage — the biology, the signals, and the decisions behind the Cellar Insights platform.
Course modules
Each chapter moves from biology to signal to decision. Click any module to begin.
What you will be able to do
- Separate rot presence from rot risk, and explain why that distinction drives monitoring.
- Name the major storage pathogens and use cut-surface, texture, and odour cues to form a field differential.
- Walk the storage season as phases, each with its own setpoints and dominant risk.
- Score incoming lots, read early sensor signals, and choose interventions matched to the rot mechanism.
- Explain the Rot Risk Index — what it is, what it is not — and translate its four bands into action.
- Frame early action as an expected-value decision and speak to its ROI credibly with customers.
About This Course
Potato Rot School teaches storage managers, growers, customer-success reps, agronomists, and processor partners how to understand storage-rot biology, recognize disease and risk patterns, interpret environmental and sensor signals, separate true spoilage risk from normal storage variability, and act early enough that intervention still has economic value.
Each chapter moves from biology to signal to decision: why a problem occurs at the level of the organism and the pile, how that biology shows up in observable and sensor signals, then what a competent operator does about it. The goal is decision quality under uncertainty, not memorization of thresholds.
Why Potato Rot Happens in Storage
- Distinguish rot presence from rot risk, and explain why the distinction drives monitoring.
- Describe tuber respiration as a metabolic engine and predict how temperature, oxygen, and wounding change it.
- Explain the wound-healing (suberization) response and why it is the tuber's primary defense in storage.
- Trace the infection chain from field and harvest through to expanding storage decay.
- Explain why early detection has disproportionate economic value.
1.1 · The tuber is a living organism, not inventory
A potato in storage is metabolically active. After harvest it continues to respire, drawing in oxygen and releasing carbon dioxide, water vapour, and heat. University of Idaho Extension describes respiration as a metabolic process that yields CO₂, H₂O, and energy released mostly as heat. The simplified equation that every storage decision ultimately traces back to is:
Read it as a budget. Sugar and oxygen go in; carbon dioxide, water, and heat come out. Every term on the right is something a storage manager must remove or manage: CO₂ must be ventilated, water must not be allowed to condense, and heat must be carried away before it accelerates the reaction further.
This matters at scale. A large pile generates substantial, continuous oxygen demand and a continuous CO₂ and heat load — most acutely when freshly harvested potatoes are still warm. If that heat is not removed, pile temperature rises, which raises the respiration rate, which generates more heat: a self-reinforcing loop that storage engineers design ventilation specifically to break.
1.2 · Temperature is the master variable
Within the normal storage range, respiration responds strongly to temperature. As a working rule of thumb, biological reaction rates roughly double for each ~10 °C (18 °F) rise — the Q10 relationship. The practical consequence is that warm pulp temperatures at fill are the single largest controllable driver of early-season risk: warm tubers respire hard, throw off heat and moisture, and are more susceptible to disease development and weight loss. University of Idaho identifies temperature as the greatest driver of respiration rate and stresses that temperature control is crucial for storage life.
Respiration does not fall to zero at low temperature, and it has a second, less intuitive complication: at low holding temperatures (below roughly 7 °C / 45 °F), tubers convert starch to reducing sugars — cold-induced sweetening — which is a quality problem for processors even when the pile is microbiologically sound. Chapter 3 returns to this trade-off because it is why holding-temperature targets differ by end use.
1.3 · The tuber's defense: wound healing and suberization
Intact potato skin (periderm) is a robust barrier. Almost every storage pathogen in Chapter 2 requires a wound, a cut, or a natural opening (lenticel) to establish infection. The tuber's primary in-storage defense is therefore its ability to seal wounds, and the operator's primary early job is to give it the conditions to do so.
Wound healing — the curing or suberization period — proceeds in two biological stages. First, cells beneath the wound deposit suberin, a waxy, water-resistant polymer that closes the surface within a few days. Second, a new layer of cork-producing cells (wound periderm) divides beneath the suberized layer and regenerates true skin over roughly one to two weeks. Both stages require oxygen, warmth, and high humidity. Extension guidance converges on holding sound tubers at 50–60 °F and ~95 % relative humidity for 10–21 days to drive this process.
If relative humidity is too low during curing, suberization is poor and a dry, starchy layer can form over the wound instead of a sealed periderm — leaving the entry point open. Poor suberization encourages rot and excessive moisture loss for the rest of the season. Drying a freshly wounded crop too aggressively does not protect it — it disarms it.
1.4 · Rot presence versus rot risk
Confirmed rot is not the same as rot risk. A pile can carry every risk factor — wounds, warm pulp, wet harvest, clods, poor airflow, rising CO₂, latent infection — long before anyone can see, smell, or sample a rotten tuber. Worse, several of the most damaging pathogens (soft-rot bacteria, ring rot) are routinely latent: present and viable without visible symptoms until conditions tip them over. The entire premise of sensor-driven monitoring is to detect the pattern of conditions early enough that the operator can still protect crop value.
1.5 · The risk chain
Warm tubers deserve special emphasis. Higher pulp temperatures increase respiration rate, raise the heat load, and make tubers more susceptible to disease and weight loss; harvesting in hot weather followed by slow cool-down measurably increases storage-rot likelihood.
1.6 · Key takeaways
- Most storage-rot problems are set up before or during harvest, then become visible later in storage.
- Respiration is the engine: temperature drives it, and unmanaged heat makes it accelerate.
- Intact skin and healed wounds are the tuber's defense; curing conditions (warm, humid, oxygenated) build that defense.
- Wounds, free water, warm temperatures, low oxygen, and poor airflow all raise risk.
- Monitoring exists to detect risk — including latent infection — before visible symptoms dominate the pile.
1.7 · Practice exercise
Scenario. A grower harvested after a wet week. Pulp temperatures were high in one field. The crop was placed in a mixed-lot storage with some bruising and clods. CO₂ rises faster than normal during the first month.
Questions & suggested answer+
What are the top three risk factors, and which would you address first? What should be checked before changing a setpoint? What should be documented now?
- Top factors: warm/high-respiration crop, wet harvest, and wounding (bruising/clods) in a mixed lot. Address the warm-crop heat load first via ventilation, because it compounds every other factor.
- Check airflow uniformity, condensation zones, incoming lot maps, and temperature gradients before assuming the CO₂ rise is decay — recent ventilation or fill changes can explain it.
- Document lot identity, harvest conditions, pulp temperature, fill date, ventilation settings, sensor trends, and any visual/odour observations.
1.8 · Unit test
1. What is the difference between rot presence and rot risk?Show answer
2. Why does warm pulp temperature at fill matter so much?Show answer
3. Why does curing require high humidity, not dry air?Show answer
Major Storage Diseases and Rot Types
- Name the causal organisms behind the major storage rots and place each in its biological class.
- Distinguish wet rots from dry rots by mechanism, not just appearance.
- Use cut-surface, texture, and odour cues to form a field-level differential diagnosis.
- Recognize that correct identification changes the management response — and that some diseases demand regulatory escalation.
2.1 · Why naming the organism matters
"Rot" is not one thing. The storage rots are caused by biologically distinct organisms — bacteria, oomycetes (water moulds), and true fungi — each with its own infection route, favoured conditions, and behaviour in the pile. Treating them as interchangeable leads to expensive mistakes: applying a post-harvest fungicide to a crop showing only bacterial soft rot wastes time and money, because the fungicide does nothing to a bacterial problem.
Cut a suspect tuber and wait ~30 minutes. Step 1 — what is the tissue like?
Tissue: {{ tissueLabel }} · Step 2 — the odour?
Cut-surface cue. {{ diagResult.cue }}
Disposition. {{ diagResult.disp }}
Cut-surface cue. {{ diagResult.cue }}
Disposition. {{ diagResult.disp }}
2.2 · The storage-rot compendium
Bacterial soft rot (Pectobacterium and Dickeya spp.)
The classic wet rot, caused by pectolytic soft-rot Pectobacteriaceae — chiefly Pectobacterium species (e.g. P. carotovorum, P. atrosepticum, P. parmentieri, P. brasiliense) and Dickeya species (e.g. D. dianthicola, D. solani), formerly grouped under Erwinia.
- Mechanism: secretes plant-cell-wall-degrading enzymes (pectate lyases and related pectinases) that dissolve the pectin holding tuber cells together, macerating tissue into wet, soft slurry.
- Favoured by: free water, low oxygen (hypoxia), warm temperatures, and wounds. Facultative anaerobes — low-O₂, water-logged conditions are exactly where they outcompete the tuber's defenses.
- Latency: commonly latent — bacteria sit in lenticels and wounds without symptoms until high humidity, hypoxia, reduced dormancy, or senescence let them multiply. A clean-looking lot is not a clean lot.
- Signs: wet, slimy, cream-to-tan breakdown with a sharp foul/putrid odour; a clear macerated boundary; spreads fastest through wet zones and pooled drainage.
- Storage behaviour: opportunistic and fast. It frequently follows other rots (pink rot, leak, dry rot, frost injury) as a secondary invader.
Pink rot (Phytophthora erythroseptica)
A wet rot caused by a soil-borne oomycete, tightly linked to wet, poorly drained soils and warm conditions late in the season.
- Mechanism: grows through the whole tuber from soil-borne oospores; in storage it spreads tuber-to-tuber by direct contact and mycelial growth, not airborne spores.
- Favoured by: high soil moisture, warm soils (~50–86 °F, optimum near 77 °F), and wounding — though it can infect unwounded tubers in the field.
- Signature cut test: internal tissue is rubbery with a "boiled-potato" texture and a sharp line between healthy and rotted tissue; the cut surface turns pink/salmon within ~15–30 minutes, then browns. Colour change plus a sour/ammonia-like odour is the field fingerprint.
- Storage consequence: its biggest danger is that it predisposes the pile to soft rot.
Pythium leak / watery wound rot (Pythium ultimum and related spp.)
Another oomycete wet rot, but a strict wound pathogen tied to warm-harvest conditions.
- Mechanism: infects through harvest wounds, then collapses tissue rapidly into a watery, leaking mass — squeeze an affected tuber and fluid runs out.
- Favoured by: high pulp temperatures at harvest (classically hot crop, > ~65 °F / 18 °C), wounding, and warmth in early storage. Cooler harvest and rapid cool-down sharply slow it.
- Signs: granular grey cut tissue, often with a brown-to-black margin; watery exudate and a yeasty/fermented smell.
- Detection note: a leading example of a rot with a distinct volatile fingerprint detectable before visible symptoms — precisely the signal class sensor systems target.
Fusarium dry rot (Fusarium sambucinum, F. solani, and related spp.)
The most important cause of post-harvest loss across much of North America, and a true fungal disease. 11–13 species have been associated worldwide depending on region.
- Mechanism: a strict wound pathogen — cannot breach intact periderm, suberized wounds, or lenticels. The disease that most rewards good curing.
- Favoured by: wounding plus high humidity; predominant species grow best ~68–77 °F, but disease develops slowly even at the lowest safe storage temperatures, so cold storage delays rather than stops it.
- Signs: dry, sunken, wrinkled brown-to-black lesions about a month into storage; internally, hollow cavities lined with white-to-salmon mycelium, dead tissue often in concentric rings.
- Management reality: many F. sambucinum strains are resistant to benzimidazole fungicides, so chemical control is unreliable. Reducing wounding and curing well are the durable controls. Reported storage losses run 6–25 %.
Late blight tuber rot (Phytophthora infestans)
The oomycete famous for the Irish famine. Tubers are infected when spores wash from blighted foliage into the soil; infected tubers carried into storage seed larger losses.
- Signs: firm, granular, reddish-brown to coppery dry rot extending irregularly inward, often without a clean margin; frequently complicated by secondary soft rot.
- Storage consequence: a few infected tubers act as foci — keep known field-blight lots out of long-term storage and move them early.
Bacterial ring rot (Clavibacter sepedonicus) — regulatory / zero-tolerance
A different category entirely: a quarantine disease with zero tolerance in seed-potato certification. Seed-borne, spreads on contaminated equipment, and has no chemical control.
- Mechanism: a gram-positive bacterium that colonizes the vascular ring; spreads from infected seed and on contaminated cutting knives, graders, bins, and surfaces, where its protective slime lets it survive for years.
- Signs: vascular-ring discolouration turning creamy-yellow with a cheesy texture; squeezing extrudes milky ooze from the ring; surface cracks in severe cases. Critically, ring rot is usually odourless — unlike ordinary soft rot.
- What to do: treat any suspicion as a stop-and-escalate event. Lab confirmation, strict sanitation, certified-seed practices, and notification per regional regulations. A small clean sample does not clear a lot.
2.3 · Quick differential reference
| Disease | Class | Cut-surface / texture | Odour | Key condition |
|---|---|---|---|---|
| Soft rot | Bacterial | Wet, slimy, macerated; cream-tan | Foul / putrid | Free water, low O₂, warmth, wounds |
| Pink rot | Oomycete | Rubbery 'boiled'; pink→brown on air | Sour / ammonia | Wet soils, warm, late season |
| Leak | Oomycete | Granular grey, watery; fluid on squeeze | Yeasty / fermented | Warm-harvest wounds |
| Dry rot | Fungal | Dry sunken lesion; hollow cavity; rings | Musty / mild | Wounds + humidity |
| Late blight | Oomycete | Firm reddish-brown granular; irregular | Earthy | Field blight inoculum |
| Ring rot | Regulatory | Cheesy vascular ring; milky ooze | Usually ODOURLESS | Infected seed; equipment |
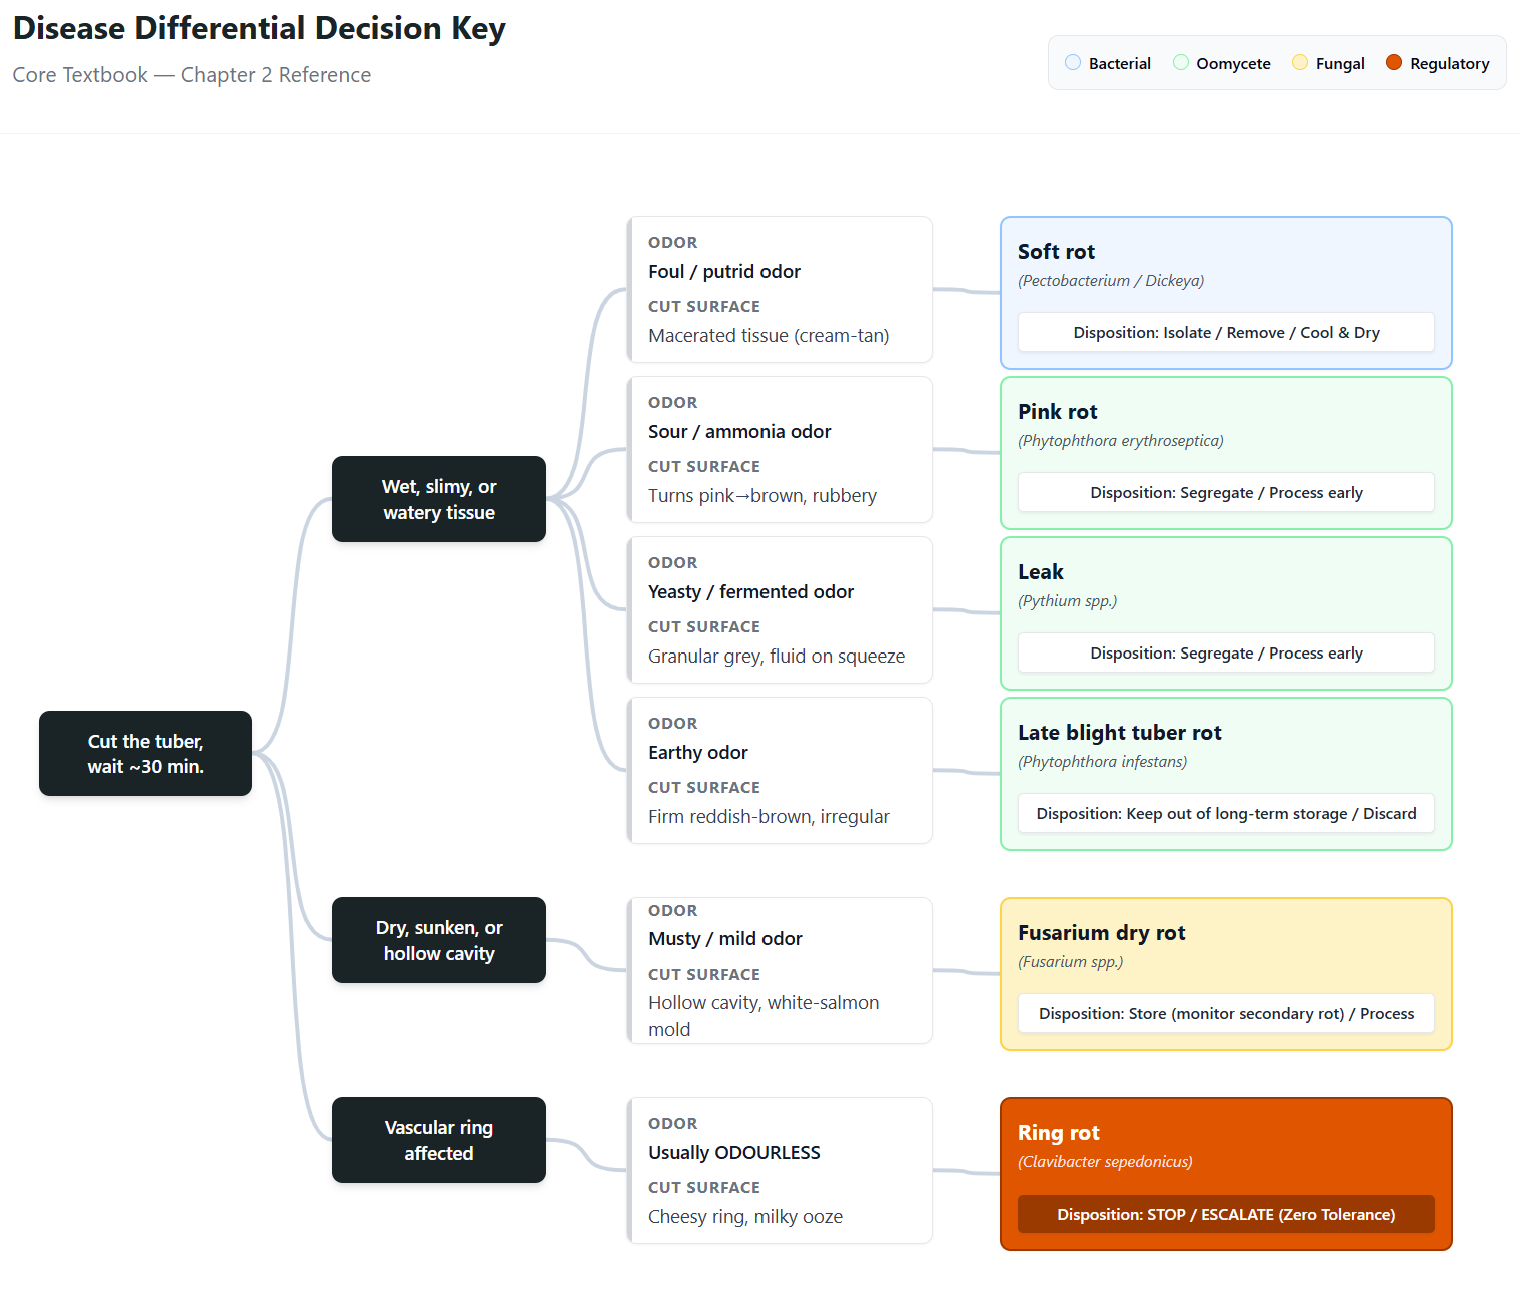
2.4 · Wet rot versus dry rot — the mechanism, not just the look
Wet rots (soft rot, pink rot, leak, late-blight tuber rot) macerate or liquefy tissue. They depend on water, are accelerated by low oxygen and warmth, and spread through wet zones and contact. They can collapse a zone in days and demand fast airflow/temperature decisions.
Dry rots (chiefly Fusarium) desiccate tissue into sunken lesions and internal cavities, progress more slowly, and depend on wounds plus humidity. They are a slower, cumulative loss that rewards prevention (low wounding, good curing) more than emergency response — but they routinely turn into soft rot once bacteria invade the lesion.
2.5 · Practice exercise
Give learners five diagnostic photos from extension publications. For each, ask: wet rot or dry rot? likely primary issue or secondary invasion? and the disposition — store, segregate, process early, discard, or escalate?
Have learners physically cut suspect tubers and watch the surface for ~30 minutes. The pink-rot colour change, the leak fluid-on-squeeze, the ring-rot milky ooze, and the dry-rot cavity are far more memorable seen than described — and the odour cues (foul soft rot vs. sour pink rot vs. odourless ring rot) are diagnostic on their own.
2.6 · Unit test
1. Which is more associated with wet, slimy breakdown — bacterial soft rot or Fusarium dry rot?Show answer
2. Why is correct identification important before any post-harvest treatment?Show answer
3. A cut tuber shows a cheesy vascular ring with milky ooze and almost no smell. Why is this an immediate escalation?Show answer
Storage Environment Fundamentals
- Explain how temperature, humidity, dew point, airflow, oxygen, and CO₂ interact to drive shrink, condensation, and disease.
- Walk the storage season as a sequence of phases, each with its own setpoints and dominant risk.
- Explain why holding-temperature targets differ by end use, including the sugar/fry-colour trade-off.
- Diagnose condensation as a dew-point problem and connect free water to soft-rot risk.
3.1 · The pile is a reactor, not a warehouse
Everything here follows from Chapter 1's respiration equation. The pile continuously produces heat, water, and CO₂. If that heat is not removed, pile temperature rises and respiration accelerates. Temperature is the greatest driver of respiration rate, and temperature control is crucial to storage life. The four environmental levers — temperature, humidity, airflow, and gas composition — are the tools for keeping that reactor in a safe operating window.
3.2 · The storage season in phases
A well-run storage is not held at one setpoint. It moves through phases, and the dominant risk changes with each.
| Phase | Typical setpoint | What you manage | Dominant risk |
|---|---|---|---|
| Preconditioning / dry-down | Field temp, high RH, fresh air as available | Remove surface water and field heat | Free water → early soft rot / leak |
| Curing (suberization) | 50–60 °F, >95 % RH, ~2–3 weeks | Wound healing and skin set | Low RH stalls healing; condensation feeds rot |
| Cooling / pull-down | Lower ≤0.5 °F per day to holding target | Reaching holding temp without shock | Too-fast cooling; condensation |
| Holding | By end use (see 3.4) | Maintaining quality through the season | Chronic shrink; slow dry rot; sugar drift |
| Reconditioning / warm-up | Warm to ~50 °F before shipping | Reducing bruise; improving fry colour | Condensation as warm air meets cold tubers |
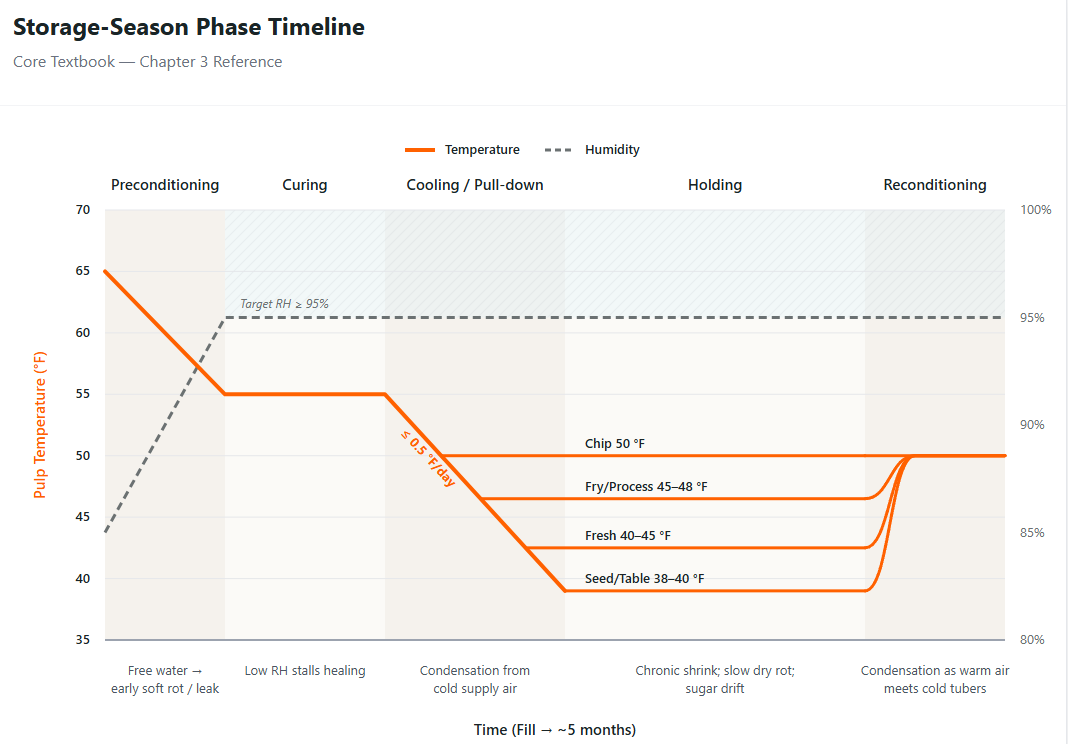
UC IPM gives the canonical early-season recipe: hold at 50–55 °F with RH above 95 % to drive rapid suberization, keep those conditions for a minimum of two weeks, then lower temperature by 0.5 °F or less per day until the holding target is reached — while avoiding condensation from warm supply air on cold tubers. Utah State adds the critical exception: when rot potential is high (field frost, late blight, or ring rot present), eliminate the curing period, drop temperature immediately, increase ventilation, and move the crop as soon as possible.
3.3 · Respiration heat, ventilation, and airflow
Ventilation is simultaneously a quality tool and a risk-control tool: it removes field heat, removes excess moisture that could condense on colder tubers, exhausts CO₂, supplies oxygen, and keeps pile conditions uniform. Airflow is sized in cfm per ton — roughly 10–20 cfm/ton is the usual optimum for normal storage, rising when warmer outside air is drawn in. Problem crops are pushed harder, up to about 25 cfm/ton. For healthy crops, intermittent air movement is enough; during curing, fans may run only a couple of hours per 24 to supply oxygen without over-drying. Ceiling-mounted circulation fans sweep humid air off the pile surface so it cannot cool to its dew point and drip back.
Airflow is usually protective — but over a pocket of active bacterial soft rot it can spread contaminated moisture and odour through the pile. Operators must reason about whether a zone needs more air (to dry and cool a developing problem) or targeted isolation/removal (to avoid broadcasting a wet rot). This judgement, not a fixed fan schedule, is the skill.
3.4 · Humidity, dew point, and why end-use temperature differs
High humidity is mostly your friend: it limits shrink. Maintain RH at 95 % or higher for optimal wound healing and minimum weight loss; below 90 %, shrink climbs rapidly — over six months, potatoes at 90 % RH can lose roughly twice the weight of those at 95 %. But excess humidity has a hard limit: when humid pile air contacts any surface below its dew point, water condenses. Those free-water films are exactly what soft-rot bacteria need to move and infiltrate lenticels.
Holding-temperature targets diverge by end use because of cold-induced sweetening: below roughly 45 °F, tubers convert starch to reducing sugars that brown on frying. Process and chip crops are held warmer to protect fry colour; seed and table stock are held colder to suppress sprouting and shrink.
| End use | Typical holding range | Why |
|---|---|---|
| Seed / table stock | ~38–40 °F | Suppress sprouting and shrink; sugar drift less critical |
| Fresh market | ~40–45 °F | Balance appearance, shrink, and sprouting |
| Chip stock | ~50 °F | Hold warm to avoid sweetening and dark chip colour |
| Fry / process | ~45–48 °F, recondition before run | Protect fry colour; warm-up reduces blackspot bruise |
3.5 · Oxygen and carbon dioxide
Oxygen and CO₂ are two sides of the respiration ledger and a direct window into pile health. Oxygen is not optional: tubers need it to respire, to power wound healing, and to hold dormancy. Dead zones with poor airflow can go hypoxic — precisely the condition that favours facultative-anaerobe soft-rot bacteria. CO₂ accumulation is both a respiration signal and, when it climbs faster than comparable cellars, a candidate decay signal; it also carries a quality cost. Many operators ventilate to keep CO₂ well below ~0.5 % (5,000 ppm), but the actionable signal is usually the trend and the comparison to baseline rather than any single absolute number.
3.6 · Practice problem
Rank rot risk and shrink risk for three storages, and justify each: A — 95 % RH, stable temperature, low CO₂, no condensation. B — 98 % RH, rising CO₂, condensation on colder walls, one warm zone. C — 88 % RH, stable CO₂, increasing weight-loss complaints.
Suggested answer+
3.7 · Unit test
1. Name three jobs ventilation does in a potato store.Show answer
2. Why can very high humidity be both helpful and dangerous?Show answer
3. Why are chip and process potatoes held warmer than seed potatoes?Show answer
Harvest-to-Storage Risk Scoring
- Assess risk before visible symptoms appear, using field and harvest records.
- Score incoming lots on a repeatable rubric and translate the score into placement and monitoring decisions.
- Decide where high-risk lots go in the building and how densely to monitor them.
4.1 · Most storage problems begin before storage
By the time a lot reaches the pile, much of its fate is already set. Wet-rot development is linked to harvest infection, wounds, skinning, and storage conditions. Assess risk before harvest with test digs, avoid risky field areas where practical, and place problem lots near the storage door when they must be stored. During filling, remove wet or rotting tubers and foreign material, do not mix good and bad lots, and place possible-problem lots near the door for easy removal.
Two earlier chapters explain why intake scoring works. The wound pathogens of Chapter 2 all need injury to enter, so bruising/skinning scores are leading indicators. And the curing phase of Chapter 3 only protects a crop that arrives in condition to heal — a hot, wet, heavily wounded lot may be past the point where curing can rescue it, which is the signal to move it early rather than commit it to long storage.
4.2 · Sample risk scorecard
Score each factor 1 (low) to 3 (high). The point is not a precise number but a repeatable conversation that surfaces the same risks every season.
| Factor | Low (1) | Medium (2) | High (3) |
|---|---|---|---|
| Harvest moisture | Dry / favourable | Mixed | Wet / muddy |
| Pulp temperature | Target range | Slightly high/low | Hot or cold stress |
| Bruising / skinning | Minimal | Noticeable | Severe |
| Field disease history | None known | Isolated | Known problem field |
| Debris / clods | Clean | Some | Heavy |
| Lot segregation | Clear | Partial | Mixed / unknown |
| Airflow confidence | Verified | Assumed | Unknown / problematic |
A single '3' on field-disease history or pulp temperature can justify high-risk handling on its own — sum and worst-case both matter.
4.3 · Cellar Insights application
Create a Rot-Risk Intake Form at install or season start. Minimum fields: field/lot ID, variety, harvest date, pulp temperature, weather at harvest, soil moisture, bruising/skinning level, disease observed, debris/clod level, storage location, and risk score. Capturing this at intake is what later makes incidents analyzable — it is the first half of the machine-learning record completed in Chapter 8.
4.4 · Practice exercise
Learners score three fictional lots, then decide which pile gets extra sensors, which lot goes closest to the door, and which should be processed earliest if risk signals rise.
Suggested pattern+
Detecting Early Rot Signals
- Map each measurable signal to the biology that produces it, so readings are interpreted rather than memorized.
- Use a confidence hierarchy that escalates from single anomalies to multi-sensor convergence to human confirmation.
- Distinguish absolute thresholds from rate-of-change and baseline-comparison signals.
- Avoid both panic (acting on noise) and complacency (waiting for obvious symptoms).
5.1 · Every signal is biology you can measure
Sensors do not detect "rot." They detect the physical and chemical byproducts of respiration, fermentation, and microbial maceration. Interpreting a reading means asking what biological process would produce it. This table is the core of the chapter — it connects each signal to its source.
| Signal | What produces it | What a rise can mean | Caveat |
|---|---|---|---|
| Temperature (local) | Respiration heat; microbial activity | Hot spot = high respiration or active decay | Airflow dead zones and sensor placement skew it |
| CO₂ | Aerobic respiration of tubers and microbes | Rising faster than peers = elevated respiration or decay | Reduced ventilation alone raises CO₂ |
| O₂ (depletion) | Consumed by respiration | Local hypoxia favours soft-rot bacteria | Pile depth and airflow drive it |
| RH / condensation | Respiration water; dew-point contact | Free-water films enable soft rot | Weather and supply-air temperature shift it |
| Ammonia (NH₃) | Protein/amino-acid breakdown in maceration | Active wet (soft) rot in progress | Strong but late-ish; pair with other signals |
| Ethanol / acetaldehyde | Fermentation when tissue goes anaerobic | Anaerobic stress or fermenting tissue | Brief hypoxia can spike then clear |
| Ethylene | Stress/wound hormone; sprouting | General stress; not rot-specific | Affects dormancy and sugars, not a decay proof |
Ethanol and acetaldehyde are mechanistically specific. When tissue runs out of oxygen, metabolism switches to fermentation: pyruvate becomes acetaldehyde and then ethanol. A rising ethanol/acetaldehyde signal points at anaerobic, often actively breaking-down tissue — which is why these volatiles, like the Pythium-leak VOC fingerprints in the research literature, can flag a problem before a human smells or sees it.
5.2 · Shrink as a monitored baseline
Weight loss is not only an economic line item — it is a signal. Healthy crops follow a predictable shrink curve, so deviation from that curve is itself an alert. The shape is steep early then flattens: roughly 3 % of weight is lost in the first 30 days (about 55–70 % of the season's loss), with total loss typically reaching about 5 % by five months. The dominant driver of normal loss is transpiration; when significant rot is present, disease becomes the largest contributor and the shrink curve runs hot. A crop losing weight faster than its expected curve, or a pile visibly sinking, is pointing at decay, not ordinary moisture loss.
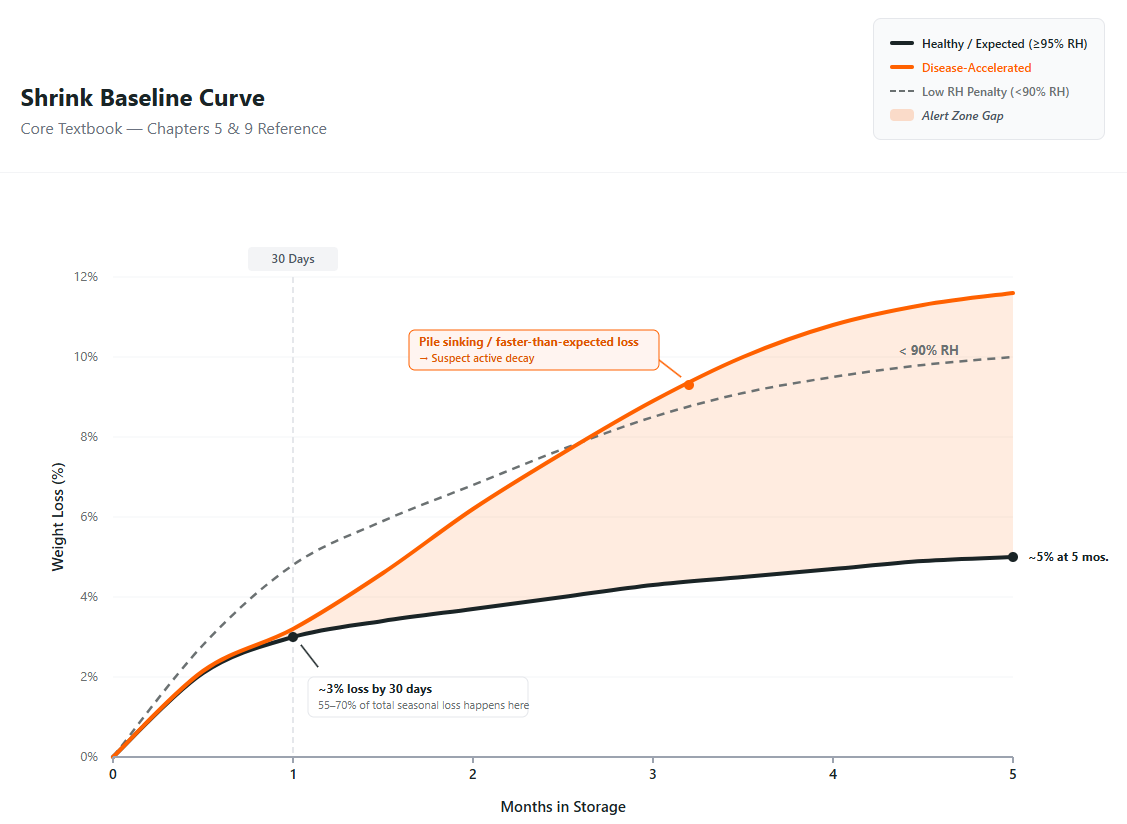
5.3 · Confidence hierarchy
The most defensible approach is a hierarchy of confidence — not a single trigger.
| Evidence level | Example | Interpretation |
|---|---|---|
| Single environmental anomaly | CO₂ spike only | Watch; review recent ventilation or operating changes |
| Persistent environmental pattern | Rising CO₂ plus high RH, sustained | Investigate if the trend persists or exceeds baseline |
| Multi-sensor convergence | Ammonia/ethanol up + rising CO₂ + warm zone | Medium-to-high confidence; inspect the likely zone |
| Human confirmation | Odour, wet tissue, photos, sample, lab result | Act or escalate by severity |
5.4 · Absolute vs. relative signals
Two readings of equal value can carry very different meaning. A CO₂ level normal in one cellar may be alarming in another running cooler. The strongest signals are usually rate of change and baseline/peer comparison, rather than a single absolute number. Teach learners to ask "compared to what?" before reacting. This is exactly the principle the Rot Risk Index (Chapter 7) automates: it tracks rises above a bin-specific baseline rather than raw ppm, smooths the daily cycling, and normalizes for bin volume so values are comparable across stores.
5.5 · Avoiding panic and complacency
A single signal can mislead. Recent ventilation changes, sensor drift, airflow dead zones, equipment changes, or weather can move readings without any decay present. Conversely, waiting for obvious smell or surface symptoms delays action past the point of economic value. The disciplined posture is a graded response — watch, investigate, act, escalate — keyed to both confidence and consequence.
5.6 · Practice problem
Scenario. A storage shows a small but persistent ammonia increase, CO₂ rising faster than comparable cellars, high RH, and one temperature cable reading a localized warm zone. Is this low, medium, or high confidence?
Suggested answer+
Response Playbooks and Intervention Logic
- Classify an event as Watch, Investigate, Act, or Escalate.
- Run a disciplined first 30 minutes and first 24 hours after an alert.
- Choose interventions that fit the rot mechanism — including when airflow helps and when it spreads the problem.
- Document actions and outcomes so each event improves the next.
6.1 · Alert-response framework
| Level | Meaning | Recommended response |
|---|---|---|
| Watch | One signal outside normal range | Review trends, check equipment, increase observation |
| Investigate | Multiple signals or a persistent anomaly | Inspect zone, verify airflow, check condensation, document |
| Act | Strong multi-sensor pattern or confirmed symptoms | Adjust ventilation/cooling/drying, sample the pile, consult advisor |
| Escalate | Confirmed spread, quality at risk, or regulatory disease | Early movement, processor/owner notification, intensive management |
The index sets priority and urgency; it does not replace physical confirmation and mechanism judgement.
6.2 · Matching the intervention to the mechanism
The right action depends on which Chapter 2 organism you suspect. A generic "ventilate more" is not always correct.
| If signals suggest… | Mechanism | First-line action |
|---|---|---|
| Wet zone, foul odour, rising NH₃ | Active bacterial soft rot | Cool and dry the zone; consider isolating/removing the wet pocket rather than blowing air across the whole pile |
| Warm spot, high respiration, no gas yet | Heat load / early stress | Increase targeted airflow to remove heat before decay establishes |
| Fermentation volatiles (ethanol) | Local hypoxia / fermenting tissue | Restore oxygen/airflow to the dead zone; inspect for a developing wet rot |
| Cheesy ring, milky ooze, no smell | Suspected ring rot (regulatory) | STOP routine management; sample, confirm by lab, sanitize, notify per regulations |
6.3 · The Problem-Pile Playbook
When a crop arrives compromised — wet harvest, frost, late blight, pink rot, leak, or visible soft rot — the normal storage rules are the wrong rules. A problem pile is managed to cool, dry, and stabilize as fast as possible, accepting some shrink and bruise as the price of saving the crop. The protocol is non-negotiable in sequence, not a menu.
Trigger — the 2 % rule
If test digs reveal about 2 % of tubers rotting or frost-damaged, bypass the common storage rules. For scattered field blight, market straight from the field if you can, or store near the door and move first. For soft rots (Dickeya, blackleg), it is often better to delay digging and let diseased tubers break down in the field — where they are easy to grade out — rather than carry them into the pile. Better in the field than in your storage.
Non-negotiables for a problem pile
- Temperature gate: do not commit compromised potatoes unless pulp temperature can be brought and held below 10 °C (50 °F) throughout the pile. Cool and dry to holding temperature as quickly as possible.
- Curing waiver: cure at the lowest possible temperature (target 10 °C) or eliminate curing entirely. A problem crop cannot afford the warm, humid curing window.
- Continuous fans: run fans continuously — recirculating even when no fresh outside air is introduced — until the crop is dry and decay is stabilized. This overrides the intermittent-ventilation logic for healthy crops.
- No humidification: it is almost certainly too wet already. Ventilate with dry air until there is no further risk of breakdown, which can take weeks.
- Keep it shallow: hold the pile as shallow as practical so air moves freely and hot-spot tubers can be removed; rotting tubers and dirt form airflow barriers.
- Hunt hot spots daily: use infrared guns every day to find developing hot spots before the pile sinks and rot spreads. Supply extra airflow to any hot spot found.
Healthy pile: intermittent ventilation is correct — short, periodic fan runs maintain uniform temperature and humidity without over-drying.
Problem pile: continuous fan operation is mandatory — run fans continuously (recirculating if needed) to drive off moisture and stabilize decay, with humidification off. Do not let an automated 'healthy crop' schedule re-engage on a compromised pile.
6.4 · First 30 minutes after an alert
- Confirm the alert details and sensor location.
- Review related sensor channels, not only the triggered one — convergence changes the confidence level.
- Check recent ventilation, humidification, refrigeration, door, and weather changes that could explain the reading.
- Decide whether immediate inspection is warranted.
- Record the decision, the rationale, and the follow-up time.
6.5 · First 24 hours
- Inspect the likely zones if confidence is sufficient.
- Check airflow, condensation, wet spots, and hot spots.
- Sample if required (see Chapter 8 for the sampling plan).
- Document observations with photos, timestamps, and location notes.
- Decide whether to adjust ventilation/cooling/drying, consult an advisor, or alert the owner/processor.
6.6 · Practice exercise
CO₂ spike onlyClassify
RH/condensation plus a warm spotClassify
Ammonia plus fermentation volatiles plus a confirmed smellClassify
The Rot Risk Index & the Dashboard
- Explain what the Rot Risk Index (RRI) is, what it is not, and why a normalized 0–100 score beats raw gas readings.
- Map the three signal tiers — pre-rot indicators, rot indicators, and accelerators — onto the biology taught earlier.
- Read the four risk bands and translate each into the right operational response.
- Interpret the Insights panel — Rot Presence, Spread Risk, and the predicted-RRI trend — and the Rot Monitor screen.
- Explain why accurate bin setup is essential to a trustworthy score.
7.1 · The problem a normalized index solves
Gases — ammonia first among them — are the earliest biological signal that spoilage is starting, well before rot is visible, smelly, or throws a heat signature. But raw gas readings are nearly impossible to act on directly: the numbers look erratic and cycle with daily conditions, so an operator staring at ppm cannot reliably tell when a real problem is beginning, whether a rise is genuine or noise, whether an intervention is helping, or which bin deserves attention first.
The Rot Risk Index turns that noise into signal. It transforms raw gas data into a clean, comparable early-warning value through baseline adjustment, smoothing, and bin-volume normalization — so the index reads the same way across bins regardless of size or airflow, and an operator can rank a whole portfolio at a glance.
More than two weeks of lead time. On average the RRI flags rot issues over two weeks earlier than manual methods — in some cases more than a month before the grower could smell anything.
24/7 coverage, no blind spots. Continuous remote monitoring of every bin replaces walkthroughs and hours of driving.
Better hold-or-ship decisions. Tracking whether rot is emerging, stabilizing, or declining gives the data to intervene or hold rather than guess.
7.2 · What the RRI is — and is not
Rot Risk Index (RRI): a daily 0–100 score that estimates the likelihood and intensity of early spoilage activity inside a storage bin, built from biochemical gas signals and the environmental conditions that influence rot. The key word is early — it detects the gas signals that precede visible or smellable rot, in most cases weeks ahead.
A higher RRI reflects stronger or more sustained indicators of decomposition, or conditions that accelerate spoilage — the same distinction Chapter 1 drew between rot presence and rot risk. Being honest about the index's limits is what earns a grower's trust:
Three things the RRI does not do
- It does not diagnose. It will not tell you where the rot is, what caused it, or which tubers are affected. The investigation still belongs to the grower.
- It does not replace judgment. It is a signal, not a mandate. Growers know their bins, crop history, and local conditions; the RRI is one more input — a good one — not the final word.
- It does not measure how much crop is lost. A score of 70 is not "70 % lost." It reflects the strength and persistence of the gas signal relative to that bin's own baseline.
7.3 · The three signal tiers behind the index
The RRI is not a single sensor. It is built from three tiers of evidence, and those tiers line up almost exactly with the chapters you have already worked through.
| Tier | What it captures | Example signals | Where covered |
|---|---|---|---|
| Pre-rot indicators | Conditions that raise the likelihood rot will develop | Late blight, waterlogged fields, rotten tubers at fill, high harvest temp, frost, bruising, prior rot; early biological stress (CO₂, VOCs/ethanol, low O₂) | Ch 4 + Ch 5 |
| Rot indicators | Signals that decomposition has started or is underway | Ammonia (primary early marker), decomposition VOCs, CO₂ spikes | Ch 5 |
| Accelerators | Conditions that increase speed, spread, or severity of rot underway | High humidity/condensation, high temperature, poor air movement | Ch 3 |
The accelerators do not necessarily cause rot, but they amplify and speed it once biological activity is underway — which is why the same gas rise means different things in different conditions.
7.4 · The four-layer pathway
| Layer | What it adds | Question it answers |
|---|---|---|
| 1 · Rot Risk Index | A clean early-warning signal from gas trends, baseline-adjusted, smoothed, volume-normalized | Is early biological activity present, and how strong? |
| 2 · Spread Risk | Temperature and humidity layered on to judge whether conditions could worsen an existing issue | Are conditions making this more dangerous? |
| 3 · Forecasting (Predicted RRI) | A forward projection of the gas trend and RRI 3–7 days ahead | Where is this heading over the next week? |
| 4 · Severity & Estimated Loss | Historical RRI + environment + forecast into a severity and % loss estimate (roadmap) | What does this likely mean for product and supply? |
7.5 · The risk bands
The 0–100 score is read in four bands. Each carries a plain-language meaning and a set of recommended actions — and the boundary that matters most is the move into the orange band. Drag the slider to explore each band:
State. {{ rriMeaning }}
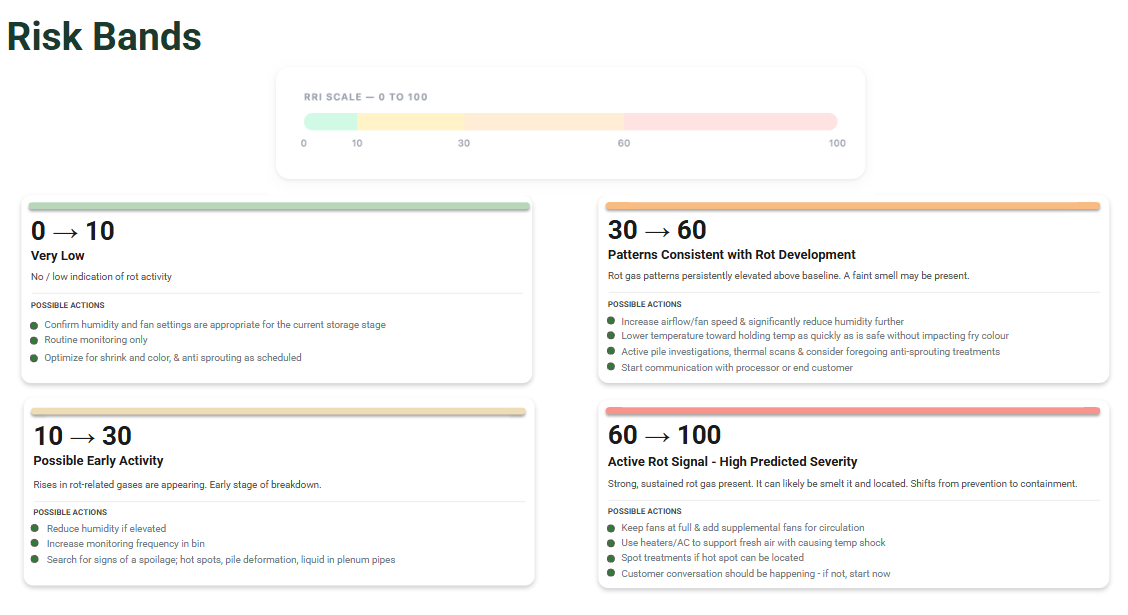
The move from yellow into the 30–60 orange band is where the index stops being a watch item and becomes an action item: fans go up, humidity comes down, temperature is pulled toward holding as fast as is safe, and the processor conversation begins. Waiting for red means waiting until the rot can be smelled and located — past the point where prevention is still on the table.
7.6 · The Insights panel
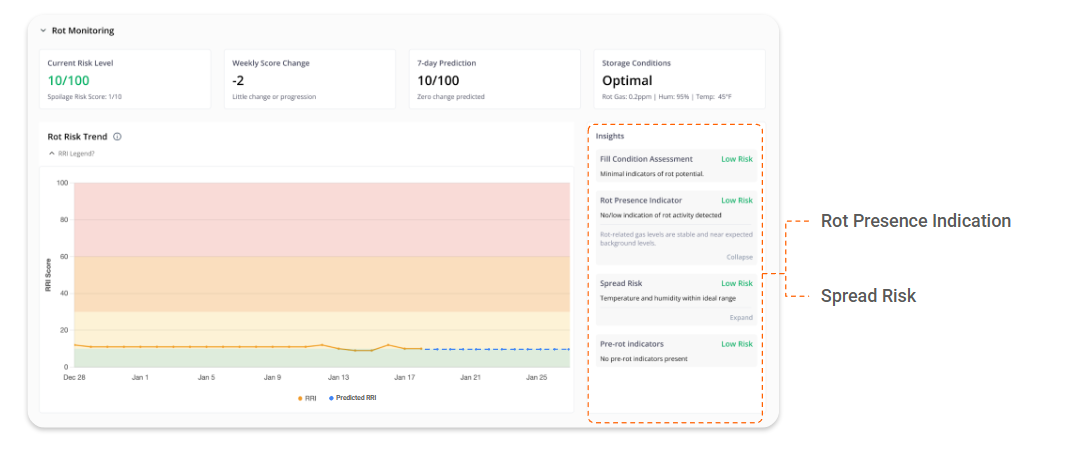
The Insights panel keeps the score from feeling like a black box — it shows why risk is where it is. Its two primary insights are the Rot Presence Indicator and Spread Risk, alongside a Fill Condition Assessment and a Pre-rot Indicators readout.
Rot Presence Indicator — the core signal
The heart of the index: whether there is evidence of rot activity, based on how far this bin's rot-gas levels have risen above its own normal baseline — not raw ppm compared across bins. It has four states.
| State | Title | Reading |
|---|---|---|
| Low (Green) | No / low indication of rot activity | Rot-gas levels low or near expected background, stable. |
| Mild (Yellow) | Possible early rot activity | Small increases have appeared; may resolve or strengthen — monitor closely. |
| Moderate (Orange) | Likely early rot development | Rot-gas levels persistently elevated above baseline, consistent with early breakdown. |
| High (Red) | Strong rot activity signal | Rot-gas levels strongly elevated and persistent — high likelihood of active decomposition. |
Spread Risk — could it get worse?
Spread Risk estimates whether current environmental conditions could worsen or accelerate an existing rot issue. It is computed as the more severe of two drivers — Spread Risk = max(Temperature severity, Humidity severity). Crucially, it only activates once the Rot Presence Indicator has stayed above Low for several consecutive days: it answers "could this get worse?", not "is there a problem?"
Predicted RRI — the dashed line
On the 7-day timeline, a dashed line extends past today: a forward-looking projection based on current trends in the rot-gas signal. It is the system's best read on where the bin is heading — not a guarantee, since conditions can change, but enough to tell whether things are likely to improve on their own or whether action may be needed.
7.7 · Reading the Rot Monitor
| Component | What it tells you |
|---|---|
| Current Risk Level | The bin's RRI right now (0–100) and its band |
| Weekly Score Change | How far the score moved over the past week — direction and momentum |
| 7-day Prediction | The forecast RRI a week out, so escalation can be anticipated |
| Storage Conditions | A plain readout of rot gas, humidity, and temperature, and whether the environment is optimal |
| Insights panel | Fill Condition Assessment, Rot Presence Indicator, Spread Risk, and Pre-rot Indicators |
7.8 · Accurate bin setup matters
The score's comparability depends on normalizing gas readings against each bin's free air volume — so bin size alone does not skew the index. That only works if the inputs are right. At onboarding and the start of each season, confirm:
- Bin capacity is entered correctly for each storage unit (dimensions included or estimated).
- Fill percentage reflects actual inventory at time of fill — not estimated or carried forward.
- Mid-season changes (partial shipments, top-ups) are recorded as they happen.
7.9 · The durable dashboard workflow
Because screens and terminology change, anchor training in the workflow rather than a click path:
- Start with the portfolio overview, sorted by RRI band and trend.
- For any bin in yellow or above, open the Insights panel — read the Rot Presence Indicator first (is this real?), then Spread Risk (could it get worse?).
- Check the 7-day predicted RRI before deciding urgency.
- Compare bins directly — but still rule out recent operating changes (ventilation, humidification, fill) that could move signals benignly.
- Match the band to a response using 7.5 and the Chapter 6 framework; annotate every material action with rationale and timestamp.
- Generate incident reports — the same records that train forecasting and loss estimates (Chapter 8).
7.10 · Dashboard case
Bin 4: RRI 46 and rising — Rot Presence Moderate (orange), Spread Risk High. Bin 7: RRI 24 (yellow) with a localized warm spot and high temp/humidity, but Rot Presence still Low, so Spread Risk has not activated. Bin 2: RRI 41, but ventilation was turned down yesterday and the rise is mostly CO₂; the system has not yet re-baselined. Which bin gets attention first?
Suggested answer+
Diagnostics, Sampling, and Validation
- Explain why a sensor signal is a hypothesis, not a diagnosis.
- Plan targeted sampling that brackets an anomaly and includes a control.
- Match a confirmation method (visual, culture, immunoassay, molecular, volatile) to the suspected organism.
- Build a machine-learning-ready case record from every confirmed event.
8.1 · Detection is a hypothesis; validation is the proof
A sensor pattern identifies a likely risk zone. It does not, by itself, name the organism or confirm crop damage. Validation requires direct observation, sampling, photos, location data, and outcome tracking. Soft-rot symptoms and odour can vary, so a smell check is useful but insufficient on its own.
Two of the most consequential pathogens — soft-rot bacteria and ring rot — are frequently latent: present and viable with no visible symptoms. A negative visual inspection of a few tubers does not clear a lot. This is why sampling logic and, for regulatory disease, lab testing matter more than a glance.
8.2 · Sampling logic
- Start with the flagged zone identified by the sensor pattern.
- Bracket the anomaly by sampling adjacent areas to map its edges.
- Include at least one control sample from a quiet area away from the anomaly.
- Capture photos, depth, and field/lot identity for every sample.
- Record both positive and negative findings — negatives are data, and they train the model.
8.3 · Confirmation methods, matched to the suspect
Different organisms call for different confirmation. Learners do not need to run these assays, but advisors and CS staff should know what each can and cannot tell them.
| Method | Best for | What it tells you |
|---|---|---|
| Cut & air-exposure test | Pink rot, leak, ring rot at point of care | Colour change, texture, ooze, odour — fast field differential |
| Selective culture (pectate media) | Pectolytic soft-rot bacteria | Whether pectolytic bacteria are present and active |
| Immunoassay (ELISA) | Some bacterial/viral targets, screening | Presence of target antigen; good for screening volume |
| Molecular (PCR / qPCR / LAMP) | Dickeya, Pectobacterium, Clavibacter, Phytophthora, Pythium, Fusarium | Specific organism ID and, with qPCR, load — confirms latent infection |
| Volatile / e-nose (FAIMS) | Pre-symptomatic leak and similar | A volatile fingerprint consistent with a specific decay before visible symptoms |
For ring rot specifically, confirmation is not optional and the stakes are regulatory: it is a zero-tolerance, seed-borne quarantine disease, and lab testing for latent infection is the recognized way to detect and eliminate infected lots.
8.4 · The machine-learning feedback loop
Every confirmed case should capture a complete record so the platform learns: storage ID, sensor location, variety, field/lot, harvest date, harvest conditions, fill date, first-alert date, first human-observation date, disease suspected, disease confirmed, action taken, and outcome. The intake form from Chapter 4 supplies the front half of this record; the validation step supplies the back half.
These records also sharpen the Rot Risk Index itself. The predictive layer (forecasting a bin's RRI 3–7 days out) and the loss layer are trained on exactly this history — confirmed outcomes tied back to the gas and environmental signals that preceded them. So validation is not just quality control on a single bin; every well-documented case, positive or negative, makes the next forecast and loss estimate more trustworthy for every customer.
Economics of Rot, Shrink, and Early Action
- Calculate avoided loss and explain the difference between chronic shrink and catastrophic rot.
- Frame action-under-uncertainty as an expected-value decision.
- Communicate the value of early action to managers and owners in their terms.
9.1 · Two different kinds of loss
Chronic shrink is the slow, season-long weight loss from respiration and moisture — largely an RH and temperature management problem. Potatoes at 90 % RH can lose roughly twice the weight of those at 95 % over six months — real money before a single tuber rots.
Catastrophic rot is the fast, localized collapse of a zone (or a contract) from an active wet rot or a regulatory disease. It is lower-probability but high-severity, and it is the loss early detection is built to prevent. A complete economic picture manages both: shrink is optimized continuously; catastrophic risk is insured against by monitoring and fast response.
9.2 · Basic avoided-loss formula
Example: 40,000 tons × $160/ton × 1.5 % = $96,000 of avoided loss.
This formula is deliberately simple, and should always be paired with context: confidence in the alert, intervention cost, quality penalties, rejected loads, labour, energy, emergency-movement cost, processor-relationship risk, and future-contract risk.
9.3 · Acting under uncertainty — the expected-value view
You do not need certainty to justify action. When the potential loss is large and the cost of investigating is small, acting on a medium-confidence multi-sensor pattern is the rational choice even if it sometimes turns out to be a false alarm. The asymmetry between a cheap inspection and a lost load is the whole argument for early monitoring.
9.4 · Practice problems
A. A grower stores 25,000 tons worth $150/ton; early action avoids 1 % loss.Solve
B. A medium-confidence alert covers a 5,000-ton zone worth $160/ton — 30 % chance of soft rot, acting cuts loss 60 %, response costs ~$1,500.Solve
9.5 · Unit test
1. Distinguish chronic shrink from catastrophic rot.Show answer
2. Why can acting on a medium-confidence alert be rational?Show answer
Building a Rot-Ready Storage Operation
- Assemble the year into a repeatable operating system: readiness, intake, monitoring, response, validation, review, improvement.
- Connect each practice back to the biology and economics that justify it.
10.1 · A rot-ready operation is a system, not a single alert
No dashboard alert builds a rot-ready operation. Repeatable practices do:
- Pre-season storage readiness — clean, sanitize, verify fans/humidification/sensors.
- Harvest intake scoring — the Chapter 4 rubric, every lot, every season.
- Weekly monitoring reviews — portfolio overview, peer/baseline comparison.
- Alert-response SOPs — the Chapter 6 Watch/Investigate/Act/Escalate logic.
- Sampling and validation standards — the Chapter 8 evidence discipline.
- End-of-season reviews — what the season's incidents taught.
- Continuous improvement across cellars and seasons — closing the ML loop.
Extension sources reinforce sanitation, lot segregation, ventilation, condensation prevention, and regular monitoring as the practical controls that this system operationalizes.
Assessments, Worksheets & Templates
Recommended assessment structure
| Assessment | Type | Weight | What it measures |
|---|---|---|---|
| Reading quizzes | Formative | 10 % | Recall, vocabulary, basic interpretation |
| Problem sets | Formative | 10 % | Quantitative reasoning and differential diagnosis |
| Dashboard lab | Formative | 10 % | Alert interpretation and workflow use |
| Midterm case | Summative | 20 % | Chapters 1–5 |
| Field/validation memo | Summative | 10 % | Validation logic and evidence capture |
| Capstone case | Summative | 15 % | Integration across the course |
| Final exam | Summative | 25 % | Full-course mastery |
The four operational worksheets
These worksheets turn the course into daily practice. Print them or rebuild them inside the Cellar Insights platform.
Final Certification Exam
Format
Example final case
A 12,000-ton storage was filled from three fields. Field B had wet harvest conditions and moderate bruising. Six weeks in, Cellar Insights reports: CO₂ trending 25 % above similar storages; consistently high RH; two short condensation events; ammonia rising slowly for five days; no strong temperature hot spot yet; and an operator reporting a faint odour near one duct.
Work the case, then reveal the expected answer:
Expected answer+
- Alert level. Investigate trending to Act. The convergence — above-peer CO₂, high RH, condensation, rising ammonia, and a faint odour — points to early bacterial soft rot even without a thermal hot spot; ammonia and the odour are the tells from Chapter 5.
- First three actions. Inspect the likely zone near the duct; check airflow and condensation; review ventilation settings; sample if warranted — favouring cooling/drying or isolation of the zone over high whole-pile airflow given the wet-rot signature.
- Records to review. Field B's lot map and harvest conditions, pulp temperatures, bruise scores, fill records, and prior alerts.
- Notify owner/GM? Yes — especially if the trend persists or crop movement may be needed; the expected-value case favours early notification.
- Enter into the platform. Inspection findings, the odour report, sensor interpretation, action taken, photos, and a follow-up date — completing the ML case record.
References & Source Key
References [11]–[26] ground the deepened technical content and operational protocols in this edition. Sources marked internal or access-limited should be handled manually.
Source key
| Key | Source | Status |
|---|---|---|
| S0 | Potato Rot School — internal syllabus / course blueprint | Internal file; no public URL |
| S1 | Rot Risk Index (RRI) — internal Cellar Insights product docs | Internal; confirm against live product docs |
| 1–4 | U. Idaho (respiration), UC IPM (storage), Nebraska (wet rots), U. Maine (soft rot) | Public — core technical grounding |
| 5–6 | U. Idaho storage-disease guide; WSU soft rot & lenticel spot | Public |
| 7–10 | Potatoes in Canada; Spud Smart / NAPSO articles & webinars | Public industry context |
| 11–26 | PNW Handbooks, UW VegPath, Cornell, MSU, U. Idaho, UMass, USU, Wisconsin, IVI, Gov. New Brunswick, plus peer-reviewed reviews | Public — added for this edition |
Full bibliography
- Teixeira, G.H. de A., et al. Respiration of Potatoes During Storage. University of Idaho Extension, BUL 1061.
- UC Statewide IPM Program. Potato: Storage. University of California ANR.
- Harveson, R.M., et al. Wet Rots of Potato in Storage. Nebraska Extension, G2203.
- University of Maine Cooperative Extension. Potato Facts: Blackleg and Bacterial Soft Rot. Bulletin #2493.
- Olsen, N., Miller, J., & Nolte, P. Diagnosis and Management of Potato Storage Diseases. U. Idaho Extension, CIS 1131.
- Washington State University Extension. Bacterial Soft Rot and Lenticel Spot on Potato Tubers.
- Banks, E., & VanOostrum, M. Important Potato Diseases and How to Manage in Storage. Potatoes in Canada.
- Ius, D. Webinar Replay: Mid-Storage Health Check. Spud Smart / NAPSO.
- Ius, D. NAPSO Webinar: New Insights and Practical Tips for Late-Season Potato Storage. Spud Smart.
- Spud Smart. Harvest Conditions and the Problems They Can Cause for Potato Storage.
- Pacific Northwest Pest Management Handbooks. Potato — Pink Rot.
- University of Wisconsin Vegetable Pathology. Potato Pink Rot.
- Cornell Vegetables. Fusarium Dry Rot of Potato — Disease Factsheet.
- University of Idaho Extension. Fusarium Dry Rot — Integrated Pest Management.
- Kirk, W.W., & Wharton, P.S. Potato Diseases: Pink Rot. Michigan State University Extension, E2993.
- University of Massachusetts Extension. Potato Harvest and Storage — Vegetable Program.
- Utah State University Extension. Potato — Harvest and Handling.
- Osdaghi, E., et al. Bacterial ring rot of potato caused by Clavibacter sepedonicus. Molecular Plant Pathology (2022).
- Rutolo, M.F., et al. Volatile biomarker-based detection of Pythium leak in postharvest stored potato tubers using FAIMS (2020).
- Ma, X., et al. Species of Dickeya and Pectobacterium Isolated during an Outbreak of Blackleg and Soft Rot in the U.S. Microorganisms (2021).
- Northeast SARE. Harvest, Cure, and Store Potatoes (grower bulletin).
- University of Wisconsin Extension. Relative Humidity: A Key to Successful Potato Storage.
- Banks, E. Guidelines to Manage Problem Potatoes in Storage. Spud Smart.
- IVI. Temperature, Humidity, and Air Movement: Key Factors to Successful Storage.
- IVI. Controlling Relative Humidity Conditions for Stored Potatoes.
- Government of New Brunswick, Department of Agriculture. Potato Storage.
High-confidence technical grounding: university and extension sources plus peer-reviewed reviews on ring rot, soft-rot Pectobacteriaceae, and volatile detection. Prefer these for claims about respiration, ventilation, humidity, curing, CO₂, and the named pathogens.
Medium-confidence operational context: Potatoes in Canada and Spud Smart / NAPSO articles and webinars.
Internal / to finalize against product docs: the Cellar Insights dashboard workflow and the Rot Risk Index — its definition, 0–100 scale, four bands, three signal tiers, four-layer pathway, Insights panel, and Rot Monitor — plus the specific sensor suite, alert thresholds, and ML details are grounded in the internal blueprint and RRI product docs. Confirm exact RRI behaviour, band thresholds, sensor specifications, and screen workflows against current Cellar Insights product documentation before external publication.
© 2026 Cellar Insights, Inc. All rights reserved. This material is proprietary to Cellar Insights and provided solely for internal training purposes; no part of it may be reproduced or distributed without prior written permission.